Data Dog Telemetry Integration
This guide is based on the official doc.
Steps to Integrate Datadog with Tailcall
- Log in to Datadog:
- Go to datadoghq.com.
- Log in to your account. Ensure you select the correct region for your account during login.
- Obtain an API Key:
- Navigate to
Organization Settings -> API Keys. - Copy the value of an existing API key or create a new one.
- Set Up OpenTelemetry Collector:
-
Integration with Datadog requires an OpenTelemetry Collector to send data. Below is a sample configuration file:
receivers:
  otlp:
    protocols:
      grpc:
        endpoint: 0.0.0.0:4317
exporters:
  logging:
    verbosity: detailed
  datadog:
    traces:
      span_name_as_resource_name: true
    hostname: "otelcol"
    api:
      key: ${DATADOG_API_KEY}
      site: us5.datadoghq.com
processors:
  batch:
  datadog/processor:
  probabilistic_sampler:
    sampling_percentage: 30
service:
  pipelines:
    traces:
      receivers: [otlp]
      processors: [batch, datadog/processor]
      exporters: [datadog]
    metrics:
      receivers: [otlp]
      processors: [batch]
      exporters: [datadog]
    logs:
      receivers: [otlp]
      processors: [batch]
      exporters: [datadog]
- Start OpenTelemetry Collector: Follow these steps to start the collector:
-
Download and Install: Download the OpenTelemetry Collector from the release page. Select the appropriate version for your platform and install it.
-
Save the Configuration File: Save the configuration above to a file named
otel-collector-config.ymlin your working directory. -
Set the Environment Variable: Replace
<your-api-key>with the API key copied earlier:export DATADOG_API_KEY=<your-api-key> -
Run the Collector: Start the collector with:
./otelcol --config otel-collector-config.yml -
Verify the Collector: Confirm that it is running by checking the terminal logs. It should indicate that the collector is listening on the
OTLPendpoint (0.0.0.0:4317).
-
Update Tailcall Configuration: Add telemetry support to your Tailcall configuration as follows:
schema
  @telemetry(
    export: {otlp: {url: "http://localhost:4317"}}
  ) {
  query: Query
} -
Set the Environment Variable for Tailcall:
- Ensure that the
DATADOG_API_KEYenvironment variable is set. - Start both the OpenTelemetry Collector and Tailcall with the updated configuration.
- Send and Analyze Data:
- Make requests to the running service.
- Wait for Datadog to process the telemetry data.
Viewing Data in Datadog
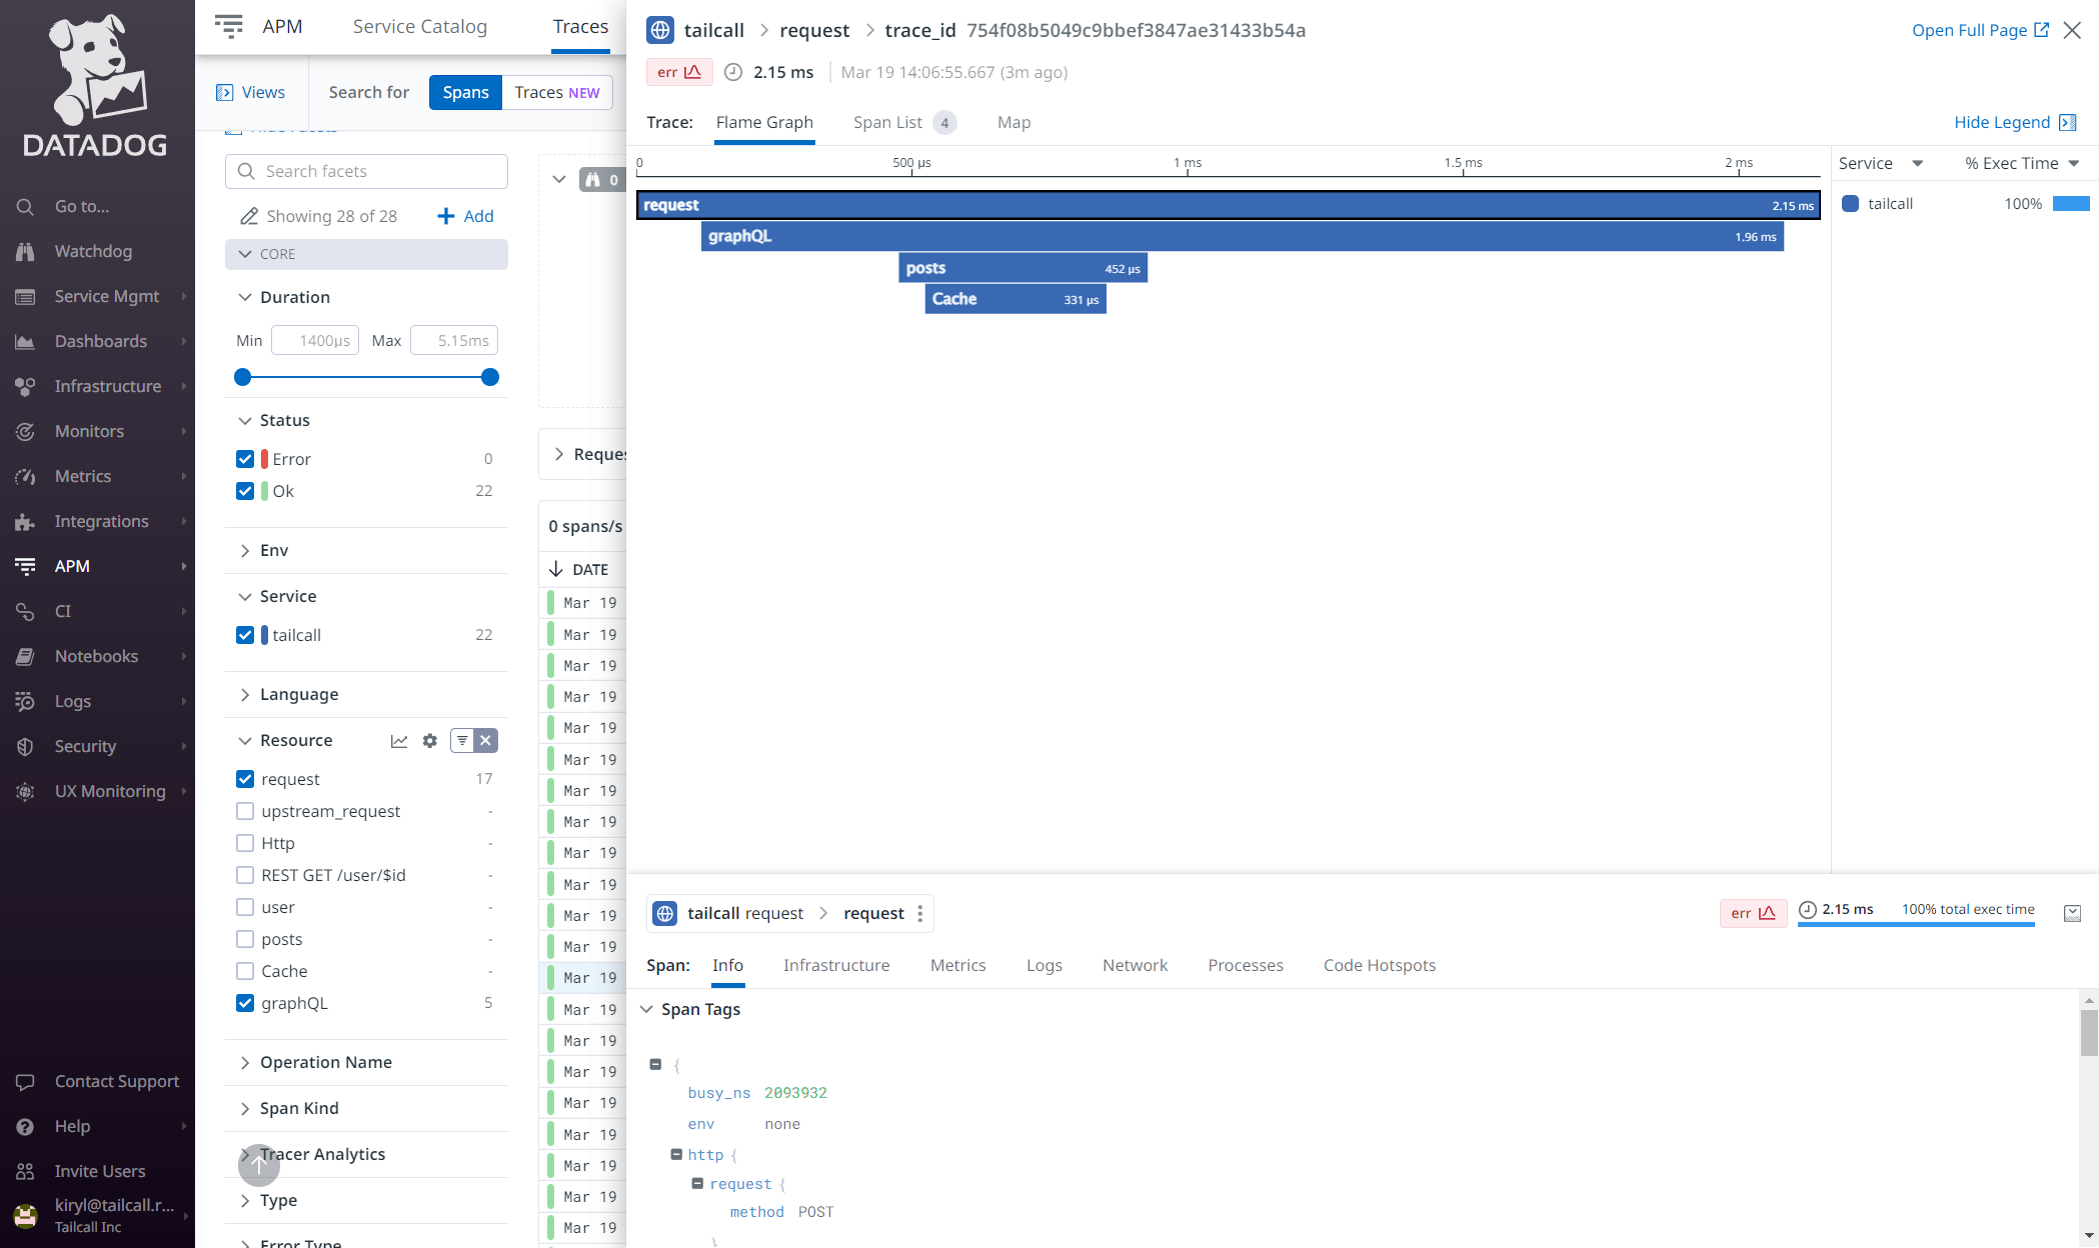
Viewing Traces:
-
Navigate to
APM -> Tracesin the Datadog dashboard. -
Locate the span named
requestand click on it. -
You should see details similar to the screenshot below:
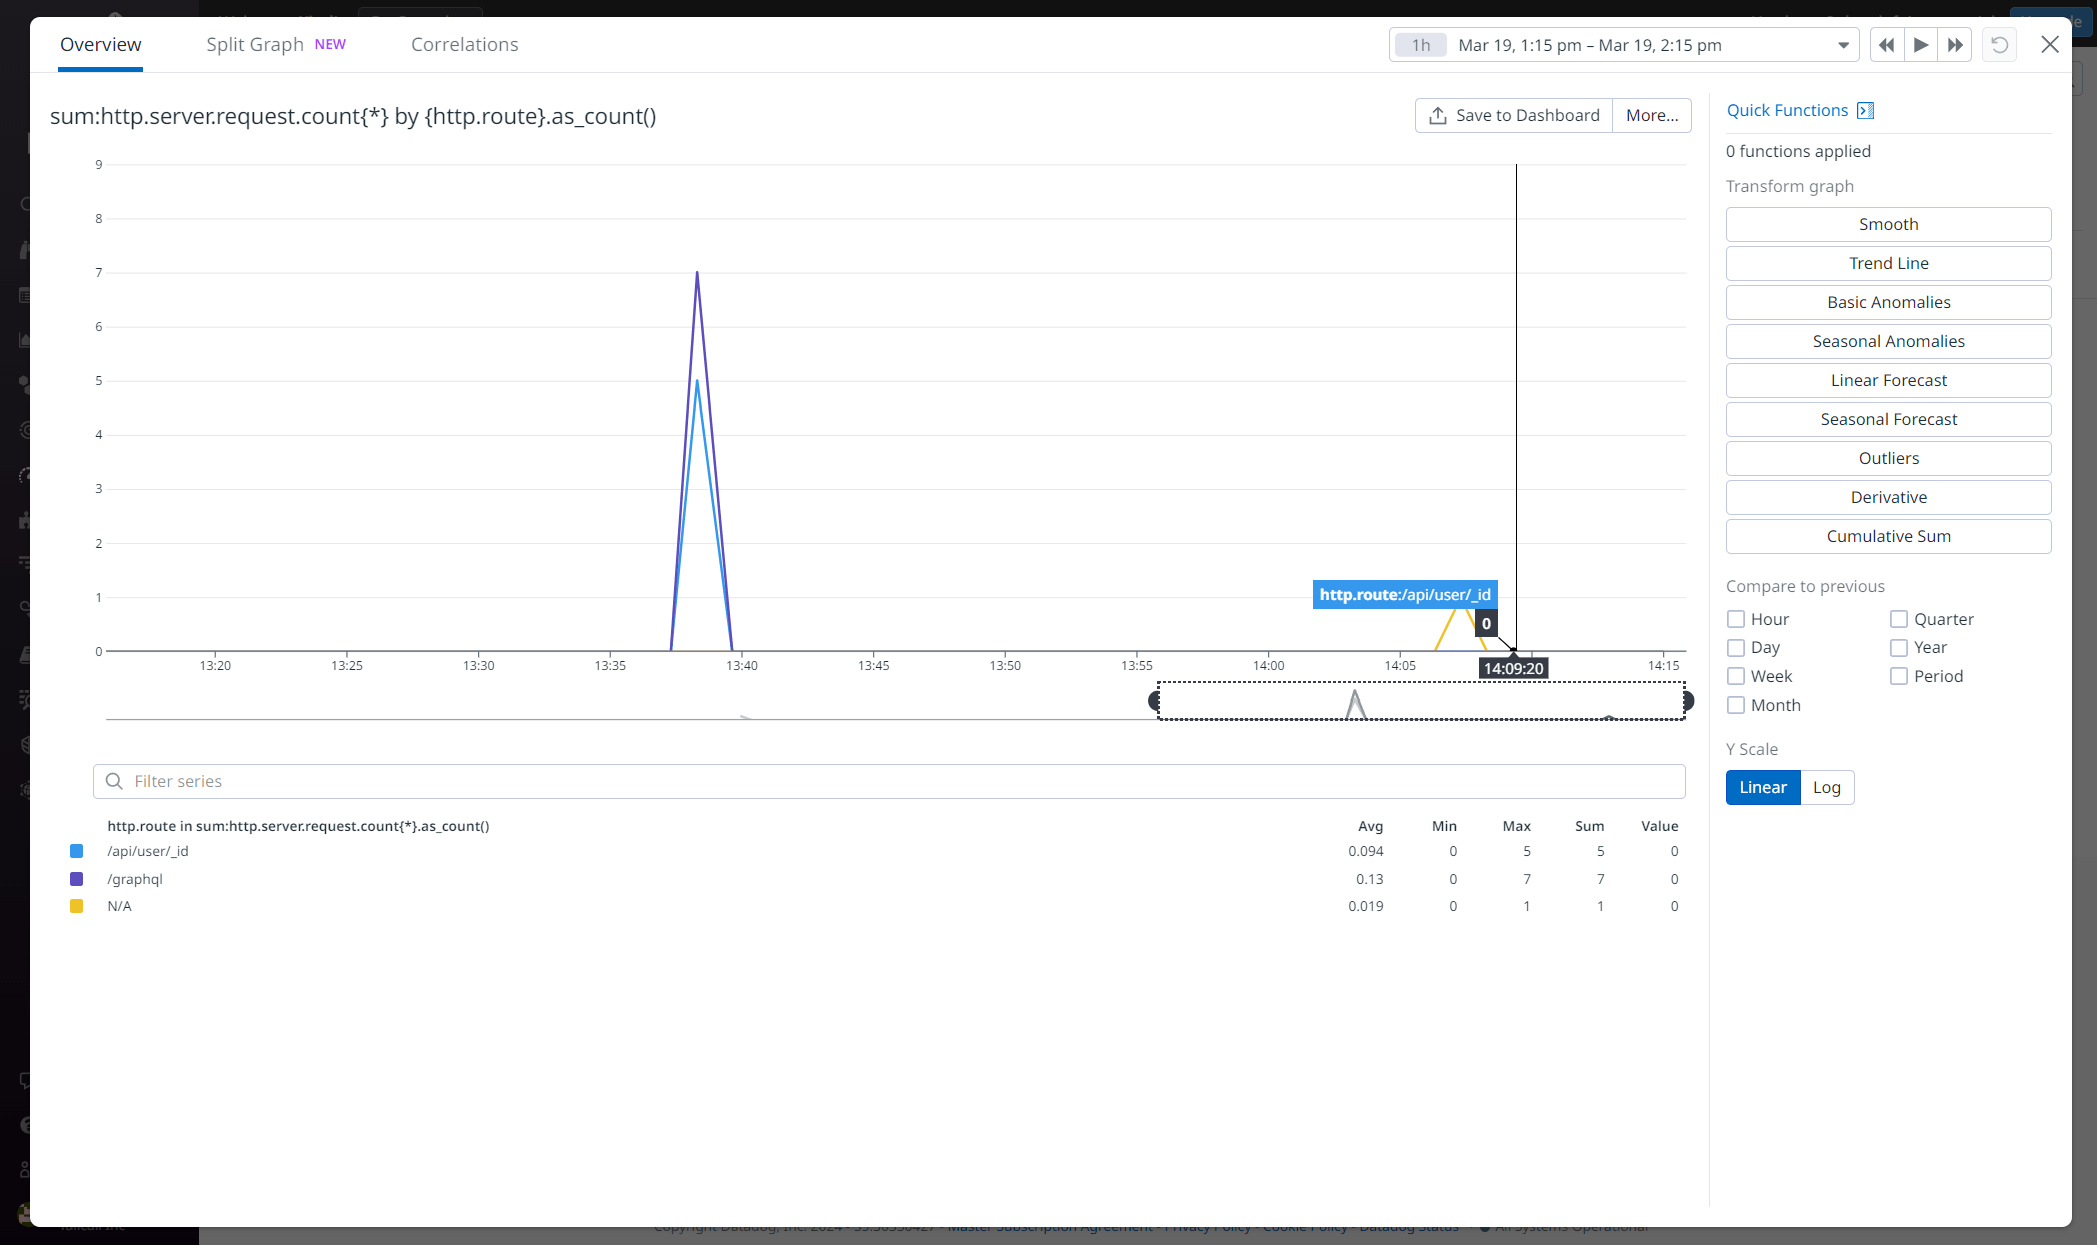
Viewing Metrics:
-
Go to
Metrics -> Explorerin the Datadog dashboard. -
Search for the desired metric.
-
Update the query to visualize data, as shown below: