Integrating Tailcall with Apollo Studio
This guide illustrates how to configure tailcall to send usage metrics to Apollo Studio.
Creating a monolith graph
-
Before you configure
tailcall, you will need to create aMonolithgraph on Apollo Studio.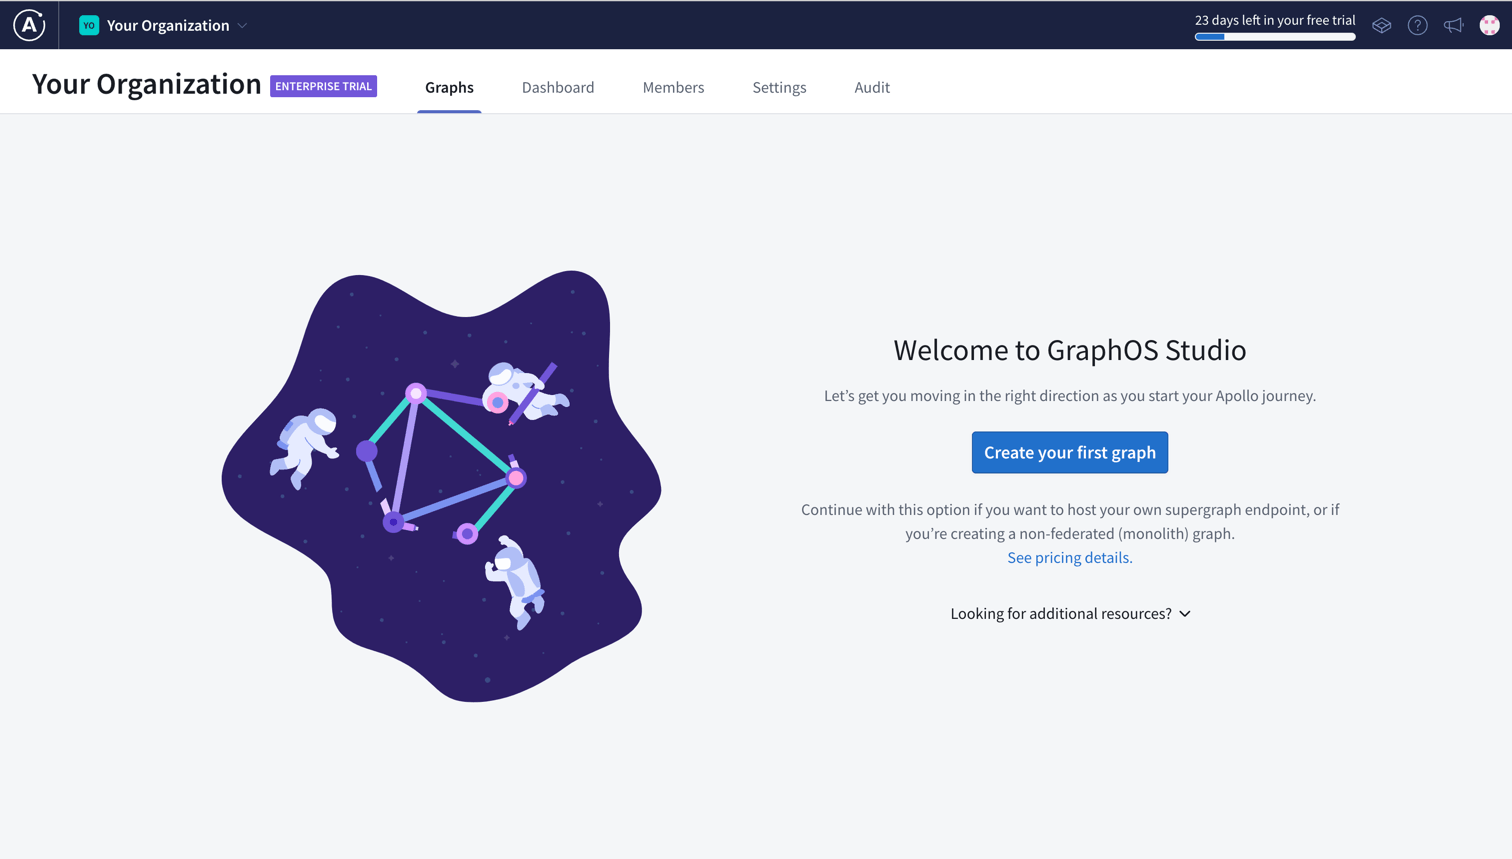
-
Go to your organization's home page and click on
Create your first graph, if this is your first graph orCreate New Graphif you have existing graphs.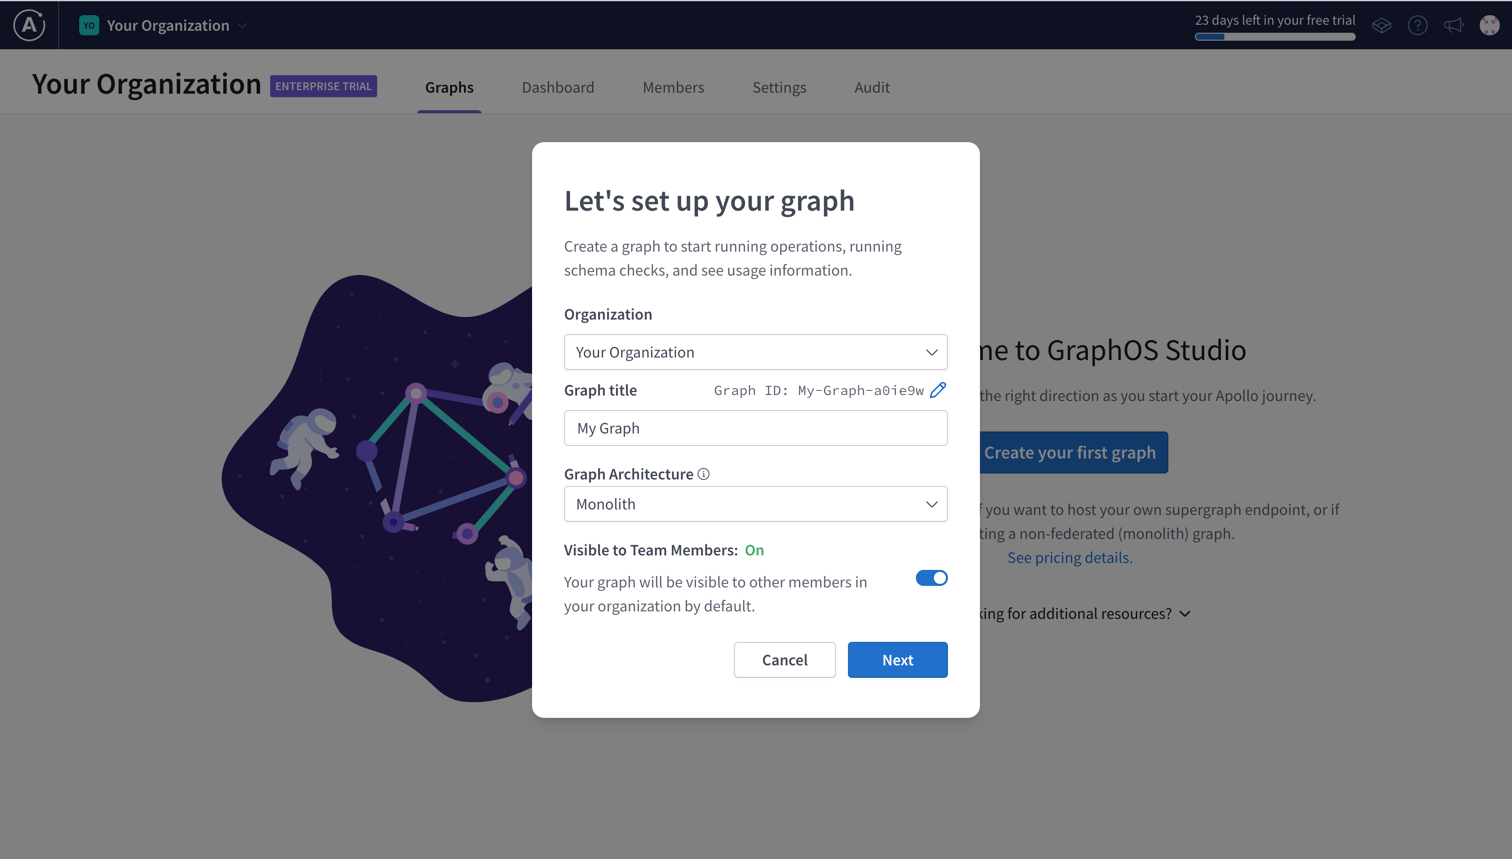
-
Change the
Graph title,Graph IDand other fields as desired and make sure to changeGraph Architectureto Monolith, assumingtailcallis booted in monolith mode. -
Once you are done, click on
Next. You'll see the following screen.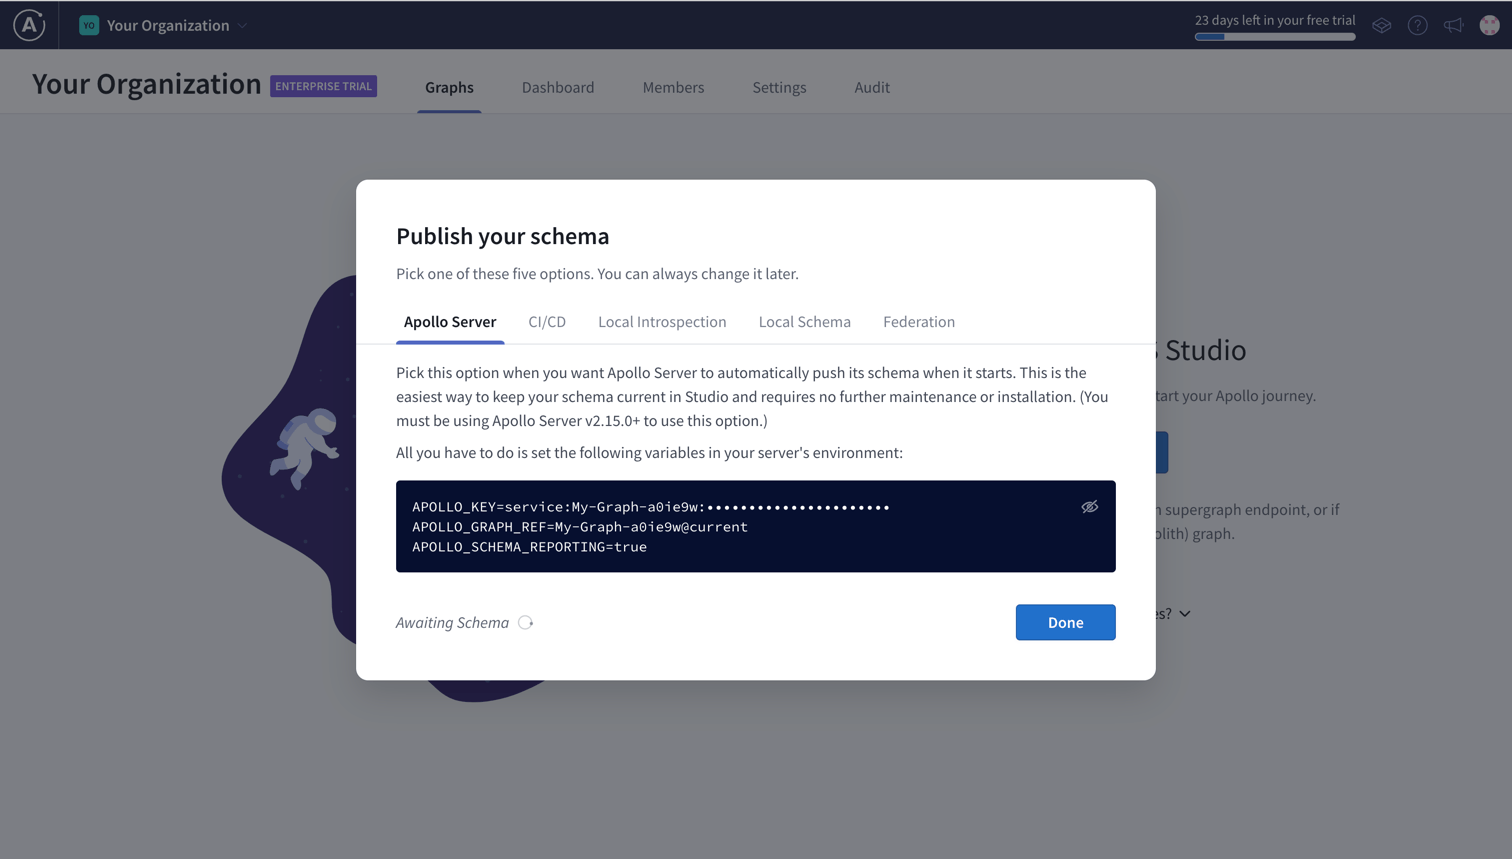
-
Copy the fields
APOLLO_KEYandAPOLLO_GRAPH_REFas they are required bytailcallto be able to send the usage metrics. -
Next we need to connect Apollo with our running instance of Tailcall. There are two ways to let Apollo know about your GraphQL schema:
-
Navigate to
Local Introspection. If you have a deployed instance of your GraphQL server you can put the URL pointing to that inEndpoint URLand click onIntrospect and Upload. If not, start a local instance oftailcalland put the local url here, similar to how is shown in the image below. You can start a local instance of Tailcall by runningtailcall start(click here to know more).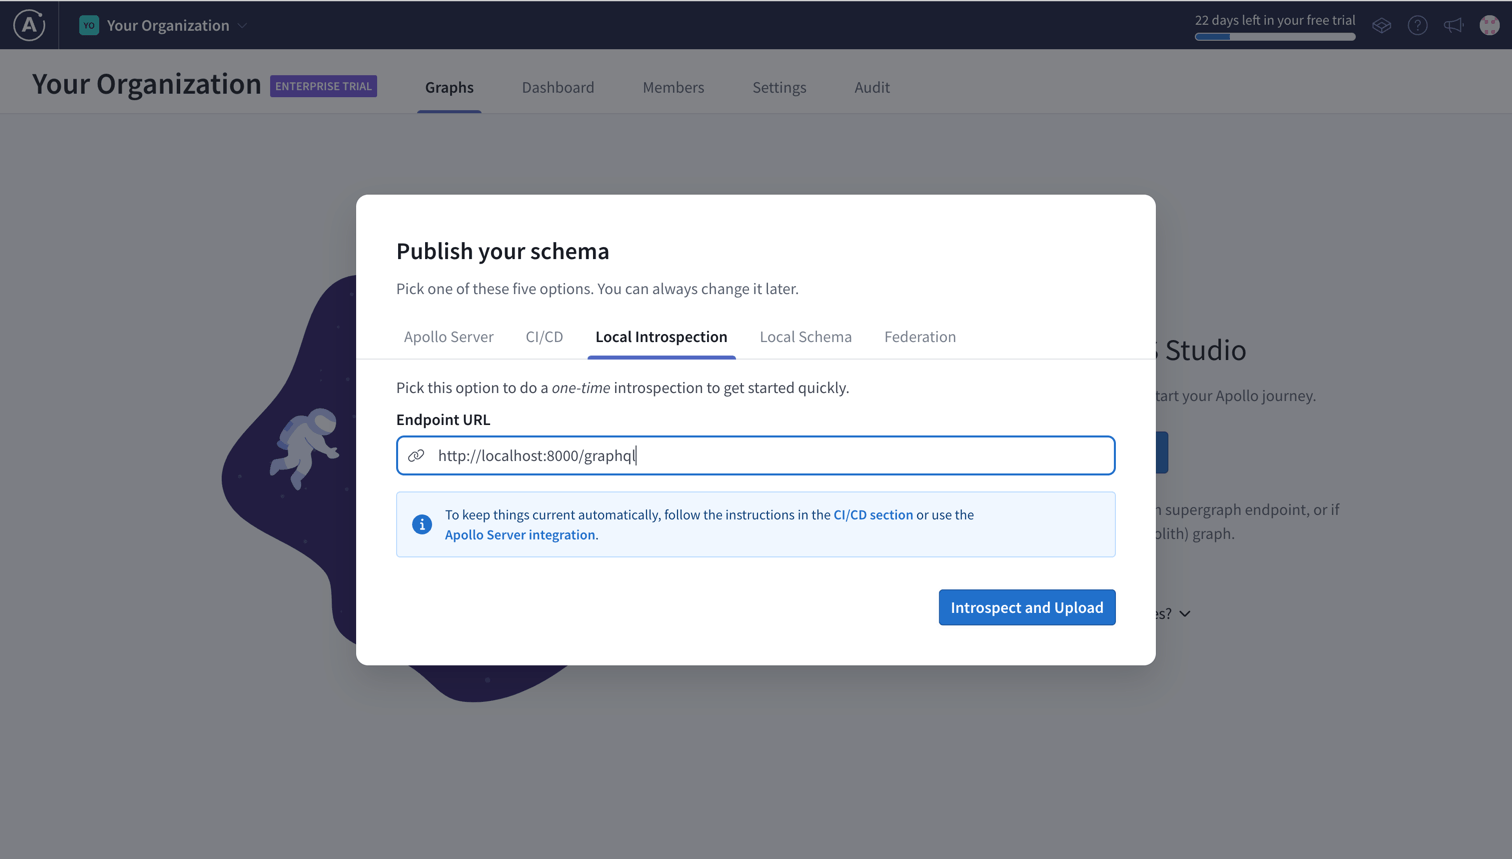
-
Or, Navigate to
Local Schemaand insert your schema generated bytailcalland clickUpload. You can get the schema by runningtailcall check(click here to know more).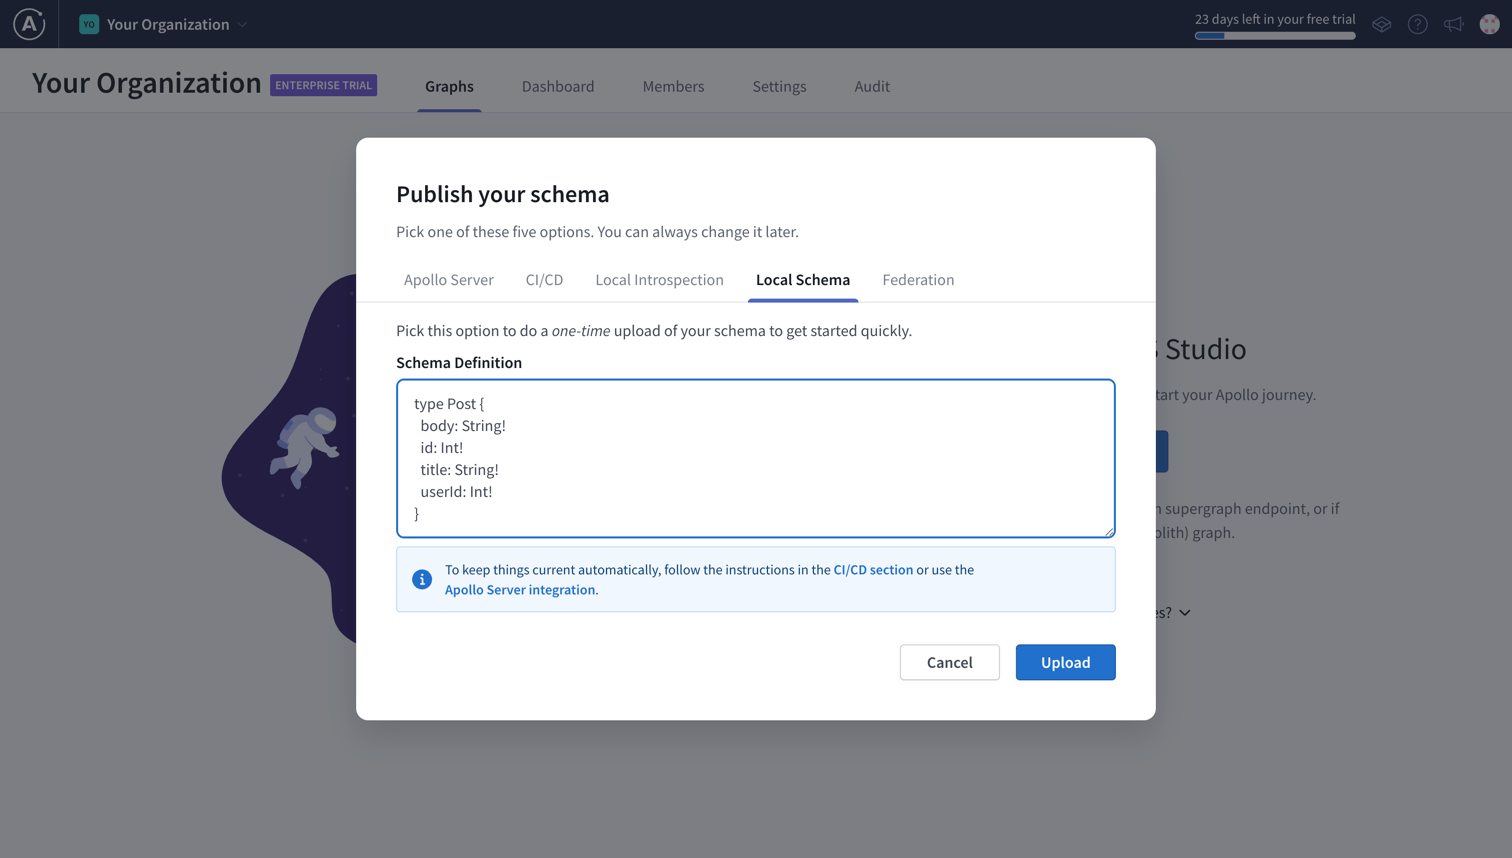
-
You have now created a Monolith graph in Apollo Studio. The next step is to configure tailcall to use the APOLLO_API_KEY and APOLLO_GRAPH_REF. Follow detailed instructions here.
Checking the metrics in Apollo Studio
To see the metrics for you queries follow these instructions:
-
Start
tailcallwith the appropriate configuration for Apollo (click here to know more). Below is an example of what a config may look like:schema
@server(port: 8000)
@telemetry(
export: {
apollo: {
apiKey: "<APOLLO_API_KEY from Apollo Website>"
graphRef: "<APOLLO_GRAPH_REF from Apollo Website>"
}
}
) {
query: Query
}
type Query {
posts: [Post]
@http(
url: "http://jsonplaceholder.typicode.com/posts"
)
}
type Post {
id: Int!
userId: Int!
title: String!
body: String!
} -
Visit
http://localhost:8000/graphqland create a query with an appropriate name (below is an example query namedMyQuery) and run it multiple times to send the metrics to Apollo Studio.tipNaming the query is not required to be able to send the metrics, but it helps to organize the metrics with appropriate names when viewed in Apollo Studio.
query MyQuery {
  posts {
    id
    title
  }
} -
To see the metrics click on the
VARIANT NAMEof your graph. In the example below, the variant name iscurrent.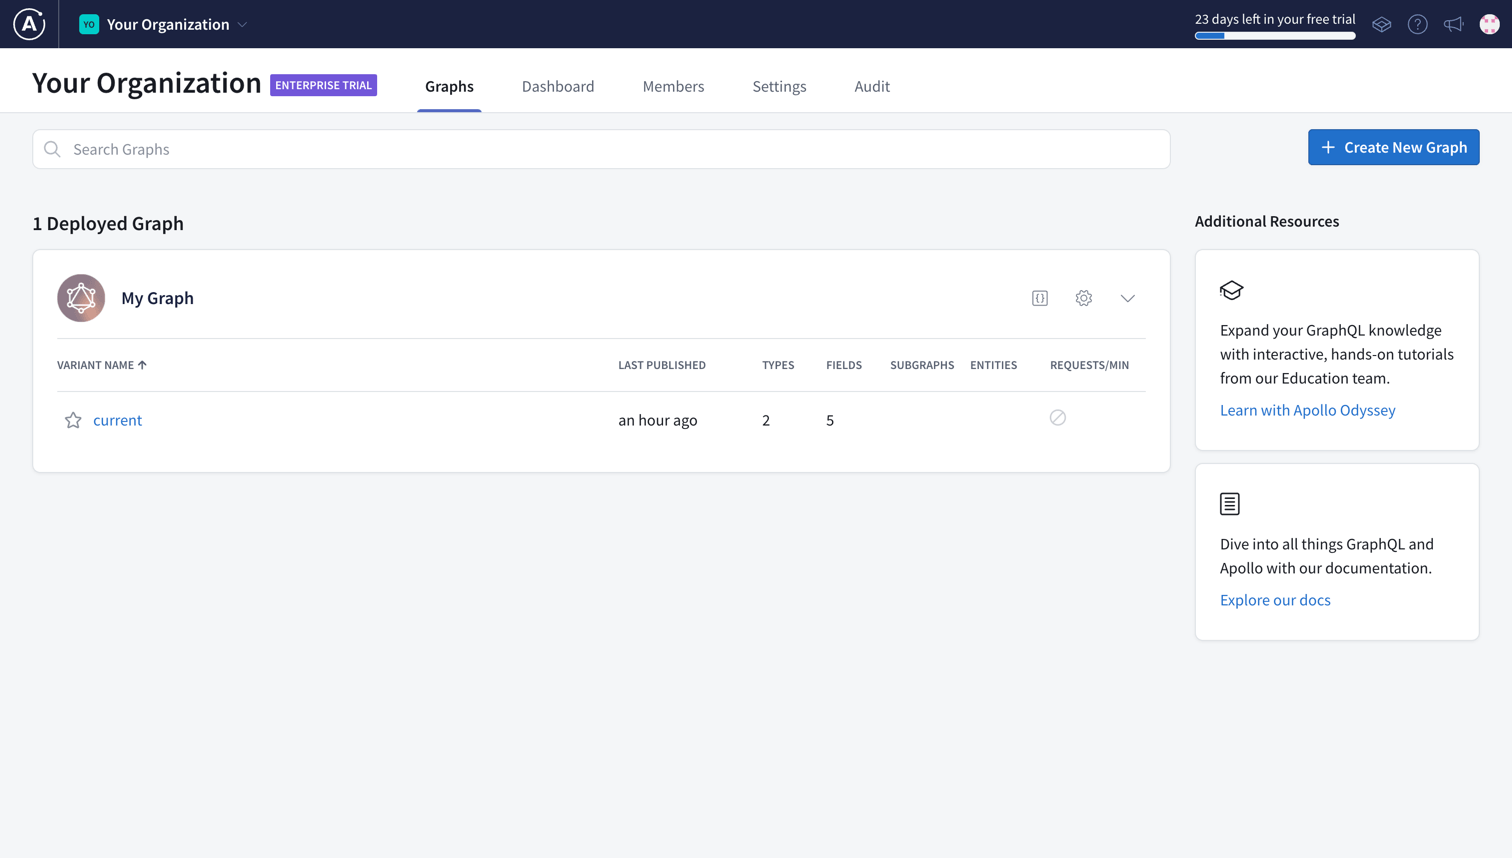
-
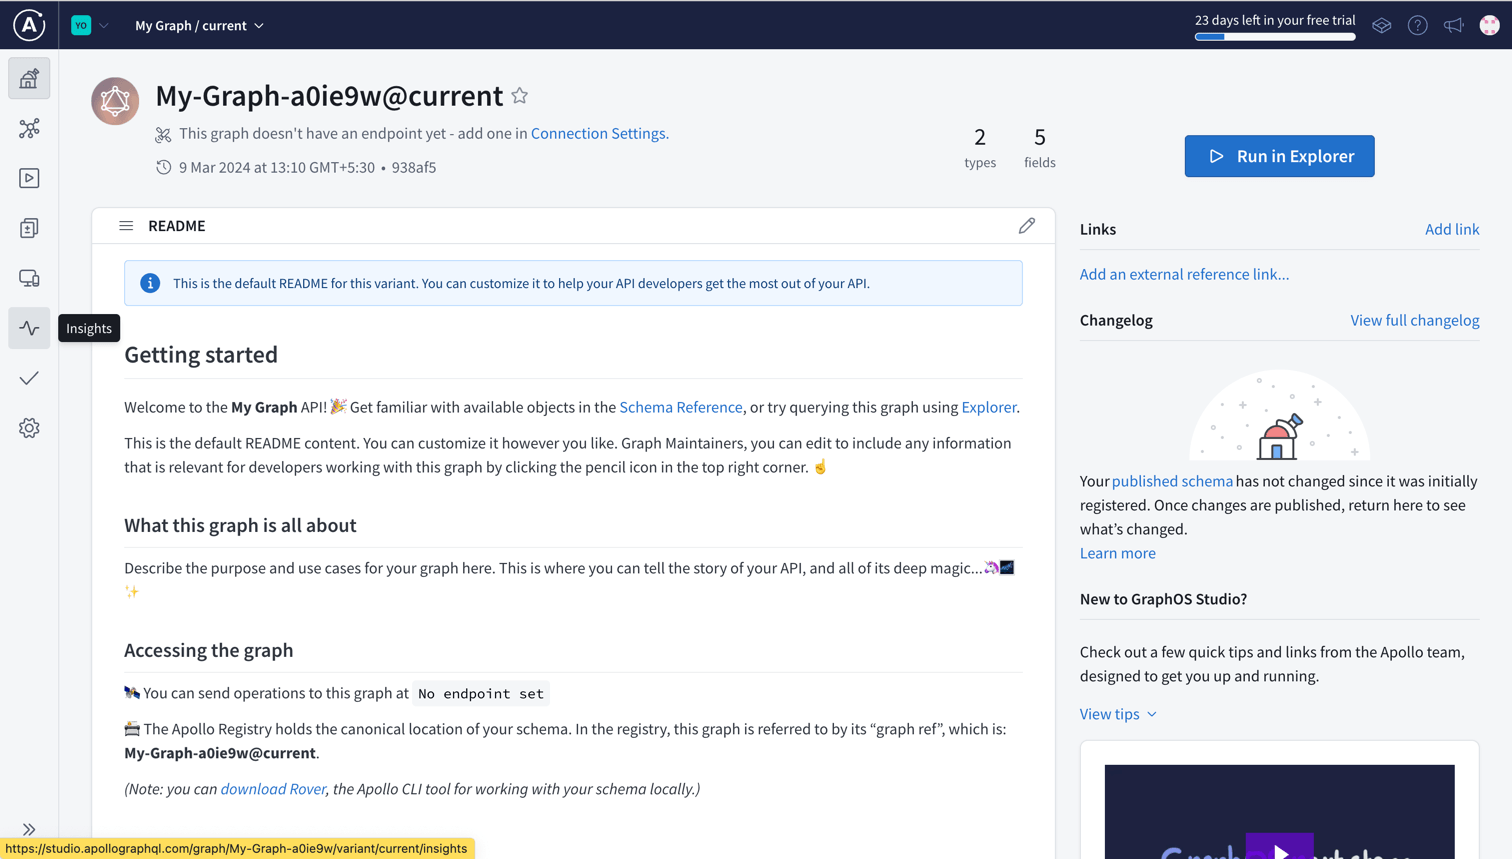
You will see the following page. From here click on insights icon as highlighted on the left side of the image.
-
You will now be able to see all the information related to your queries here
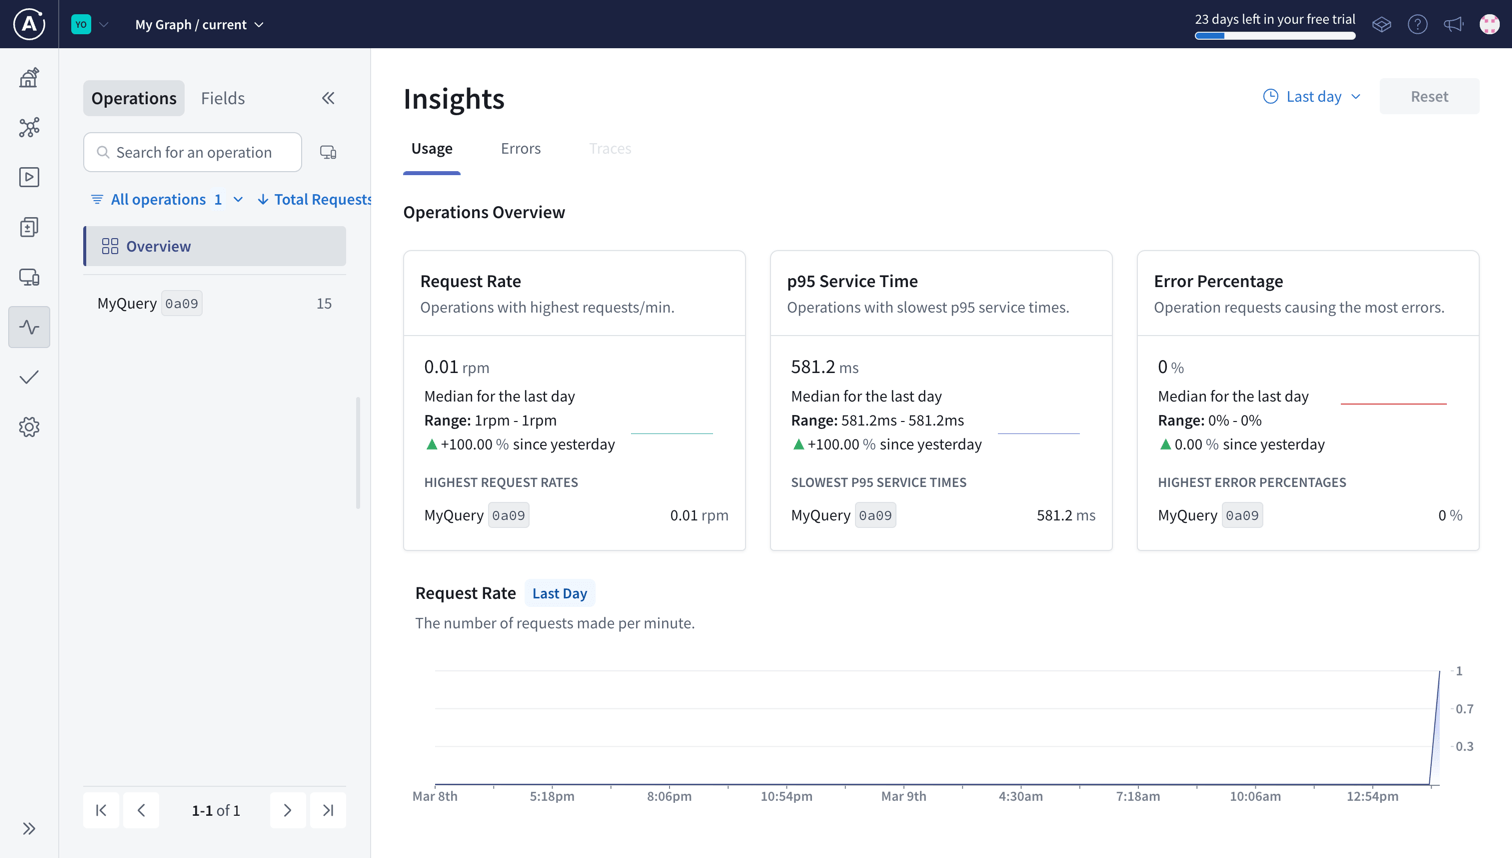
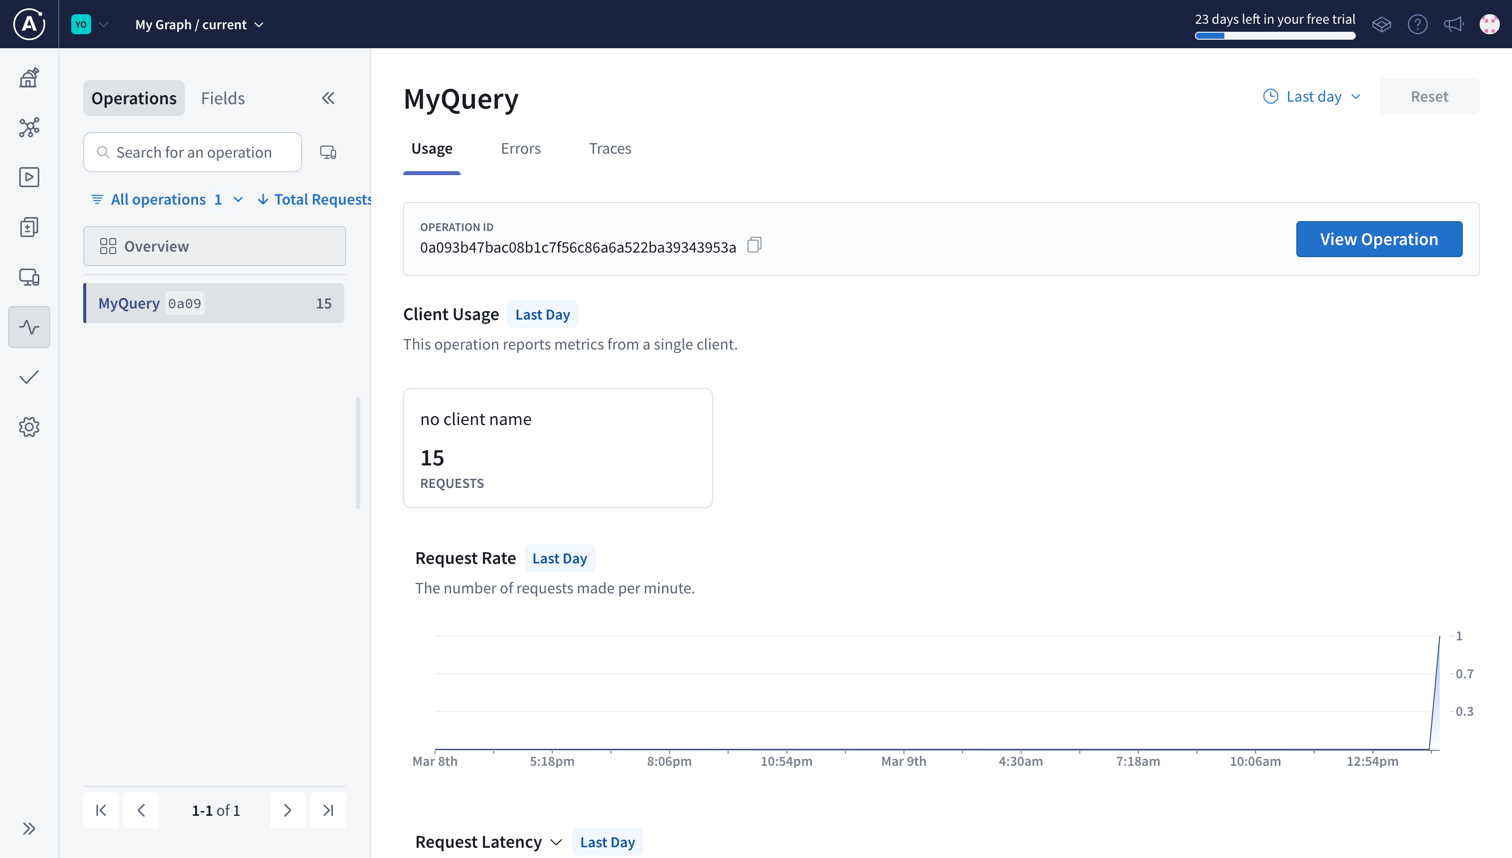
If you don't see the name of your query here, try running the query multiple times and waiting for some time. Since the metric isn't sent to Apollo Studio for each query, instead they are batched together and sent at once for efficiency reasons.